File size: 5,758 Bytes
89c8ab5 d3c85ed 89c8ab5 d3c85ed 89c8ab5 d3c85ed 89c8ab5 d3c85ed 89c8ab5 d3c85ed 89c8ab5 d3c85ed 89c8ab5 d3c85ed 89c8ab5 d3c85ed 89c8ab5 d3c85ed 89c8ab5 d3c85ed 89c8ab5 d3c85ed 89c8ab5 d3c85ed 89c8ab5 d3c85ed |
1 2 3 4 5 6 7 8 9 10 11 12 13 14 15 16 17 18 19 20 21 22 23 24 25 26 27 28 29 30 31 32 33 34 35 36 37 38 39 40 41 42 43 44 45 46 47 48 49 50 51 52 53 54 55 56 57 58 59 60 61 62 63 64 65 66 67 68 69 70 71 72 73 74 75 76 77 78 79 80 81 82 83 84 85 86 87 88 89 90 91 92 93 94 95 96 97 98 99 100 101 102 103 104 105 106 107 108 109 110 111 112 113 114 115 116 117 118 119 120 121 122 123 124 125 126 127 128 129 130 131 132 133 134 135 136 137 138 139 140 141 142 143 144 145 146 147 148 149 150 151 152 153 154 155 156 157 158 159 160 161 162 163 164 165 166 167 168 169 170 171 172 173 174 175 176 177 178 |
import streamlit as st
import matplotlib.pyplot as plt
import numpy as np
def plot_parameter_space(
alpha,
beta,
xmin=0,
xmax=1,
ymin=0,
ymax=1,
npts=500,
max_iter=40,
scheme="prism",
draw_boundary=False,
):
X = np.linspace(xmax, xmin, npts, endpoint=False)
X = np.flipud(X)
Y = np.linspace(ymax, ymin, npts, endpoint=False)
U, V = np.meshgrid(X, Y)
Z = U + V * 1j
exit_times = max_iter * np.ones(Z.shape, np.int32)
mask = Z.imag < Z.real
exit_times[np.logical_not(mask)] = 0
for k in range(max_iter):
Z[mask] = (
Z[mask].imag / Z[mask].real
+ ((Z[mask].imag - 1) / Z[mask].real + np.floor(1 / Z[mask].real)) * 1j
)
old_mask = mask
mask = np.logical_and(Z.imag > 0, Z.imag < Z.real)
exit_times[mask ^ old_mask] = k + 1
fig, ax = plt.subplots()
ax.set_xlim((xmin, xmax))
ax.set_ylim((ymin, ymax))
exit_times[0, 0] = 0
im = ax.imshow(
exit_times,
cmap=scheme,
aspect="equal",
extent=(X.min(), X.max(), Y.min(), Y.max()),
)
ax.fill_between(X, X, 1.0, color=(1, 1, 1))
if draw_boundary:
for k in range(1, 16):
ax.plot([0, 1 / k], [1, 0], "k", lw=0.5)
ax.plot([1 / k, 1 / k], [1, 0], "k", lw=0.5)
ax.plot([1 / 2, 1], [0, 1 / k], "k", lw=0.5)
# Add a dot for the current alpha and beta values
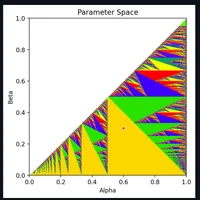
ax.plot(alpha, beta, "ro", markersize=5, markeredgecolor="white")
ax.set_title("Parameter Space")
ax.set_xlabel("Alpha")
ax.set_ylabel("Beta")
return fig
def itm_image(alpha, beta, interval):
out = []
if interval[0] < 1 - alpha:
out.append((interval[0] + alpha, min(interval[1], 1 - alpha) + alpha))
if interval[0] < 1 - beta and interval[1] > 1 - alpha:
out.append(
(max(interval[0], 1 - alpha) + beta, min(interval[1], 1 - beta) + beta)
)
if interval[1] > 1 - beta:
out.append((max(interval[0], 1 - beta) + beta - 1, interval[1] + beta - 1))
return out
def plot_images(alpha, beta, nimages=100):
images = [(0, 1)]
fig, ax = plt.subplots()
for n in range(nimages):
beg, end = zip(*images)
ax.hlines([n / nimages] * len(beg), beg, end)
images_next = []
for image in images:
images_next.extend(itm_image(alpha, beta, image))
images = images_next
ax.set_title(f"alpha={alpha:.2f}, beta={beta:.2f}")
ax.set_xlim(0, 1)
ax.set_ylim(0, 1)
ax.set_xlabel("x")
ax.set_ylabel("Iteration")
return fig
def main():
st.set_page_config(layout="wide")
st.title("Interactive Visualization of Interval Translation Maps")
st.sidebar.header("Controls")
# Initialize session state for alpha and beta if not already present
if "alpha" not in st.session_state:
st.session_state.alpha = 0.6
if "beta" not in st.session_state:
st.session_state.beta = 0.3
# Function to update alpha
def update_alpha(increment):
st.session_state.alpha = max(0, min(1, st.session_state.alpha + increment))
# Function to update beta
def update_beta(increment):
st.session_state.beta = max(0, min(1, st.session_state.beta + increment))
# Alpha control
st.sidebar.subheader("Alpha Control")
col1, col2, col3, col4, col5 = st.sidebar.columns([1, 1, 2, 1, 1])
with col1:
st.button("▼▼", on_click=update_alpha, args=(-0.1,), key="alpha_down_large")
with col2:
st.button("▼", on_click=update_alpha, args=(-0.01,), key="alpha_down")
with col3:
st.write(f"Alpha: {st.session_state.alpha:.2f}")
with col4:
st.button("▲", on_click=update_alpha, args=(0.01,), key="alpha_up")
with col5:
st.button("▲▲", on_click=update_alpha, args=(0.1,), key="alpha_up_large")
# Beta control
st.sidebar.subheader("Beta Control")
col1, col2, col3, col4, col5 = st.sidebar.columns([1, 1, 2, 1, 1])
with col1:
st.button("▼▼", on_click=update_beta, args=(-0.1,), key="beta_down_large")
with col2:
st.button("▼", on_click=update_beta, args=(-0.01,), key="beta_down")
with col3:
st.write(f"Beta: {st.session_state.beta:.2f}")
with col4:
st.button("▲", on_click=update_beta, args=(0.01,), key="beta_up")
with col5:
st.button("▲▲", on_click=update_beta, args=(0.1,), key="beta_up_large")
col1, col2 = st.columns(2)
with col1:
st.subheader("Parameter Space")
fig_param = plot_parameter_space(
st.session_state.alpha, st.session_state.beta, scheme="prism"
)
st.pyplot(fig_param)
with col2:
st.subheader("Image Plot")
fig_images = plot_images(st.session_state.alpha, st.session_state.beta)
st.pyplot(fig_images)
st.caption(
"Use the ▲/▲▲ and ▼/▼▼ buttons in the sidebar to adjust Alpha and Beta values. The red dot in the Parameter Space plot shows the current (Alpha, Beta) position."
)
st.markdown("""
## About this Visualization
This interactive tool visualizes Interval Translation Maps (ITMs) and their parameter space.
- The left plot shows the parameter space of ITMs. The red dot indicates the current (Alpha, Beta) values.
- The right plot displays the images of the interval [0,1] under repeated application of the ITM.
Use the up and down arrow buttons in the sidebar to adjust the alpha and beta parameters and observe how they affect both plots.
- Single arrows (▲/▼) change values by 0.01
- Double arrows (▲▲/▼▼) change values by 0.1
""")
if __name__ == "__main__":
main() |