Be Your Own Neighborhood: Detecting Adversarial Examples by the Neighborhood Relations Built on Self-Supervised Learning

1The Chinese University of Hong Kong, 2IBM Research

Abstract

Current studies on adversarial robustness mainly focus on aggregating local robustness results from a set of data samples to evaluate and rank different models. However, the local statistics may not well represent the true global robustness of the underlying unknown data distribution. To address this challenge, this paper makes the first attempt to present a new framework, called GREAT Score, for global robustness evaluation of adversarial perturbation using generative models. Formally, GREAT Score carries the physical meaning of a global statistic capturing a mean certified attack-proof perturbation level over all samples drawn from a generative model. For finite-sample evaluation, we also derive a probabilistic guarantee on the sample complexity and the difference between the sample mean and the true mean. GREAT Score has several advantages: (1) Robustness evaluations using GREAT Score are efficient and scalable to large models, by sparing the need of running adversarial attacks. In particular, we show high correlation and significantly reduced computation cost of GREAT Score when compared to the attack-based model ranking on RobustBench1. (2) The use of generative models facilitates the approximation of the unknown data distribution. In our ablation study with different generative adversarial networks (GANs), we observe consistency between global robustness evaluation and the quality of GANs. (3) GREAT Score can be used for remote auditing of privacy-sensitive black-box models, as demonstrated by our robustness evaluation on several online facial recognition services.

1 Croce, F., Andriushchenko, M., Sehwag, V., Debenedetti, E., Flammarion, N., Chiang, M., Mittal, P., & Hein, M. (2021). RobustBench: a standardized adversarial robustness benchmark. In Thirty-fifth Conference on Neural Information Processing Systems Datasets and Benchmarks Track (Round 2). https://openreview.net/forum?id=SSKZPJCt7B

Neighborhood Relations of AEs and Clean Samples

Neighborhood Relations of Benign Examples and AEs

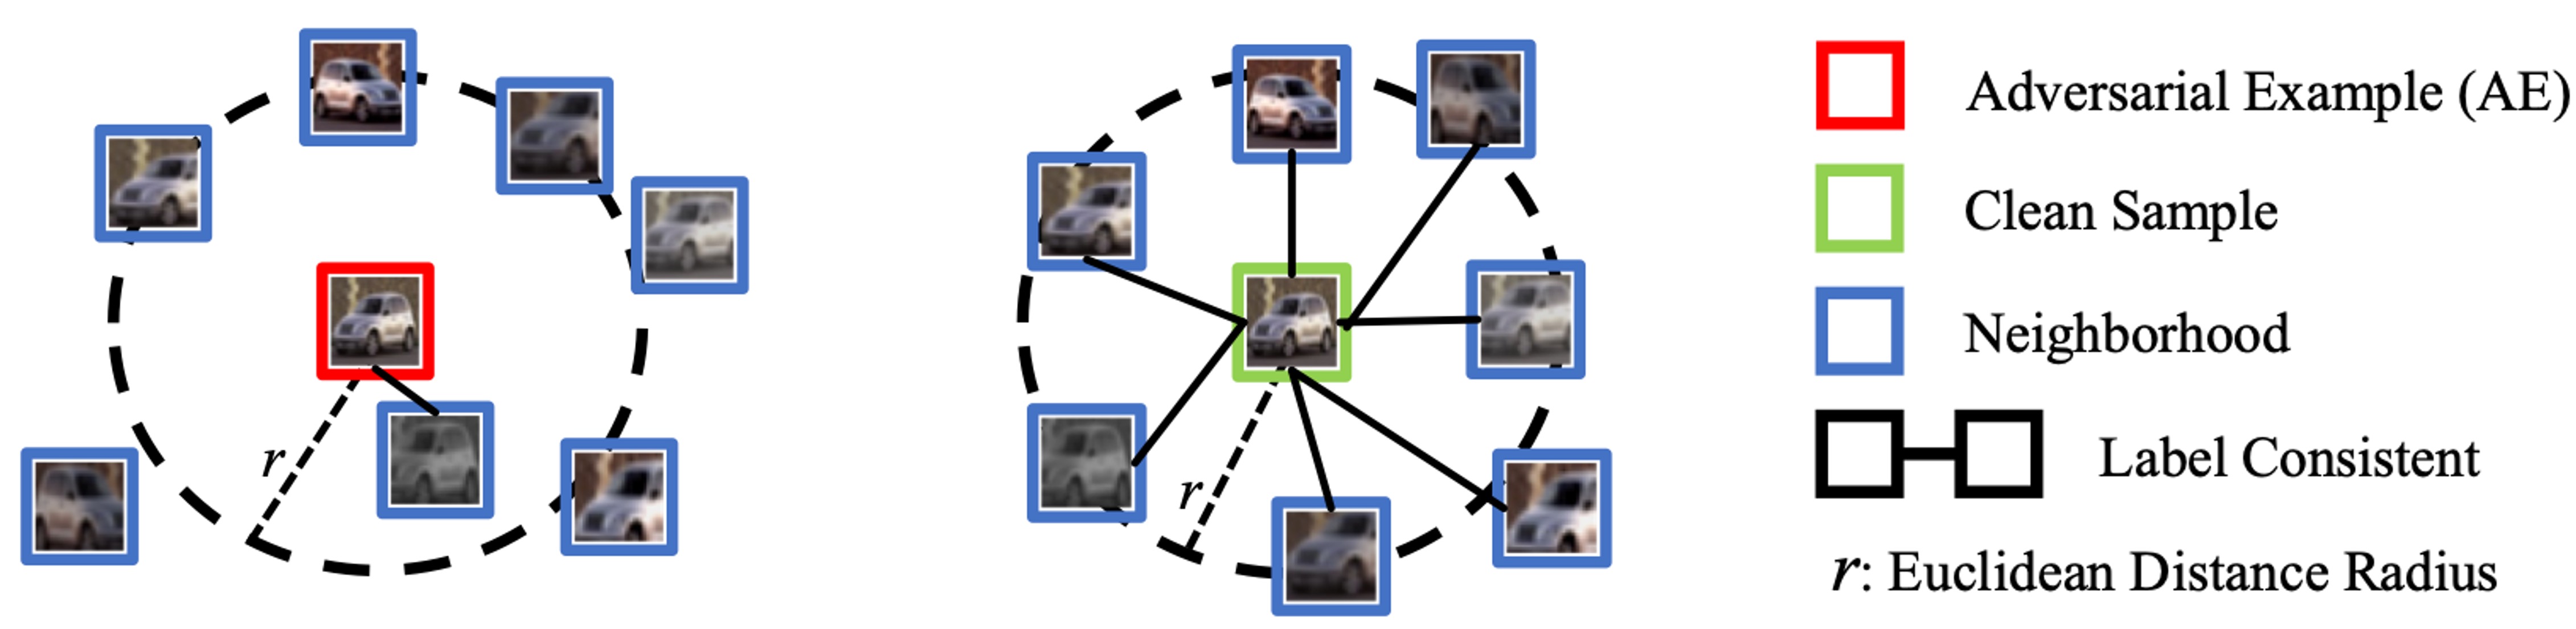
Figure 1. Neighborhood Relations of AEs and Clean Samples.

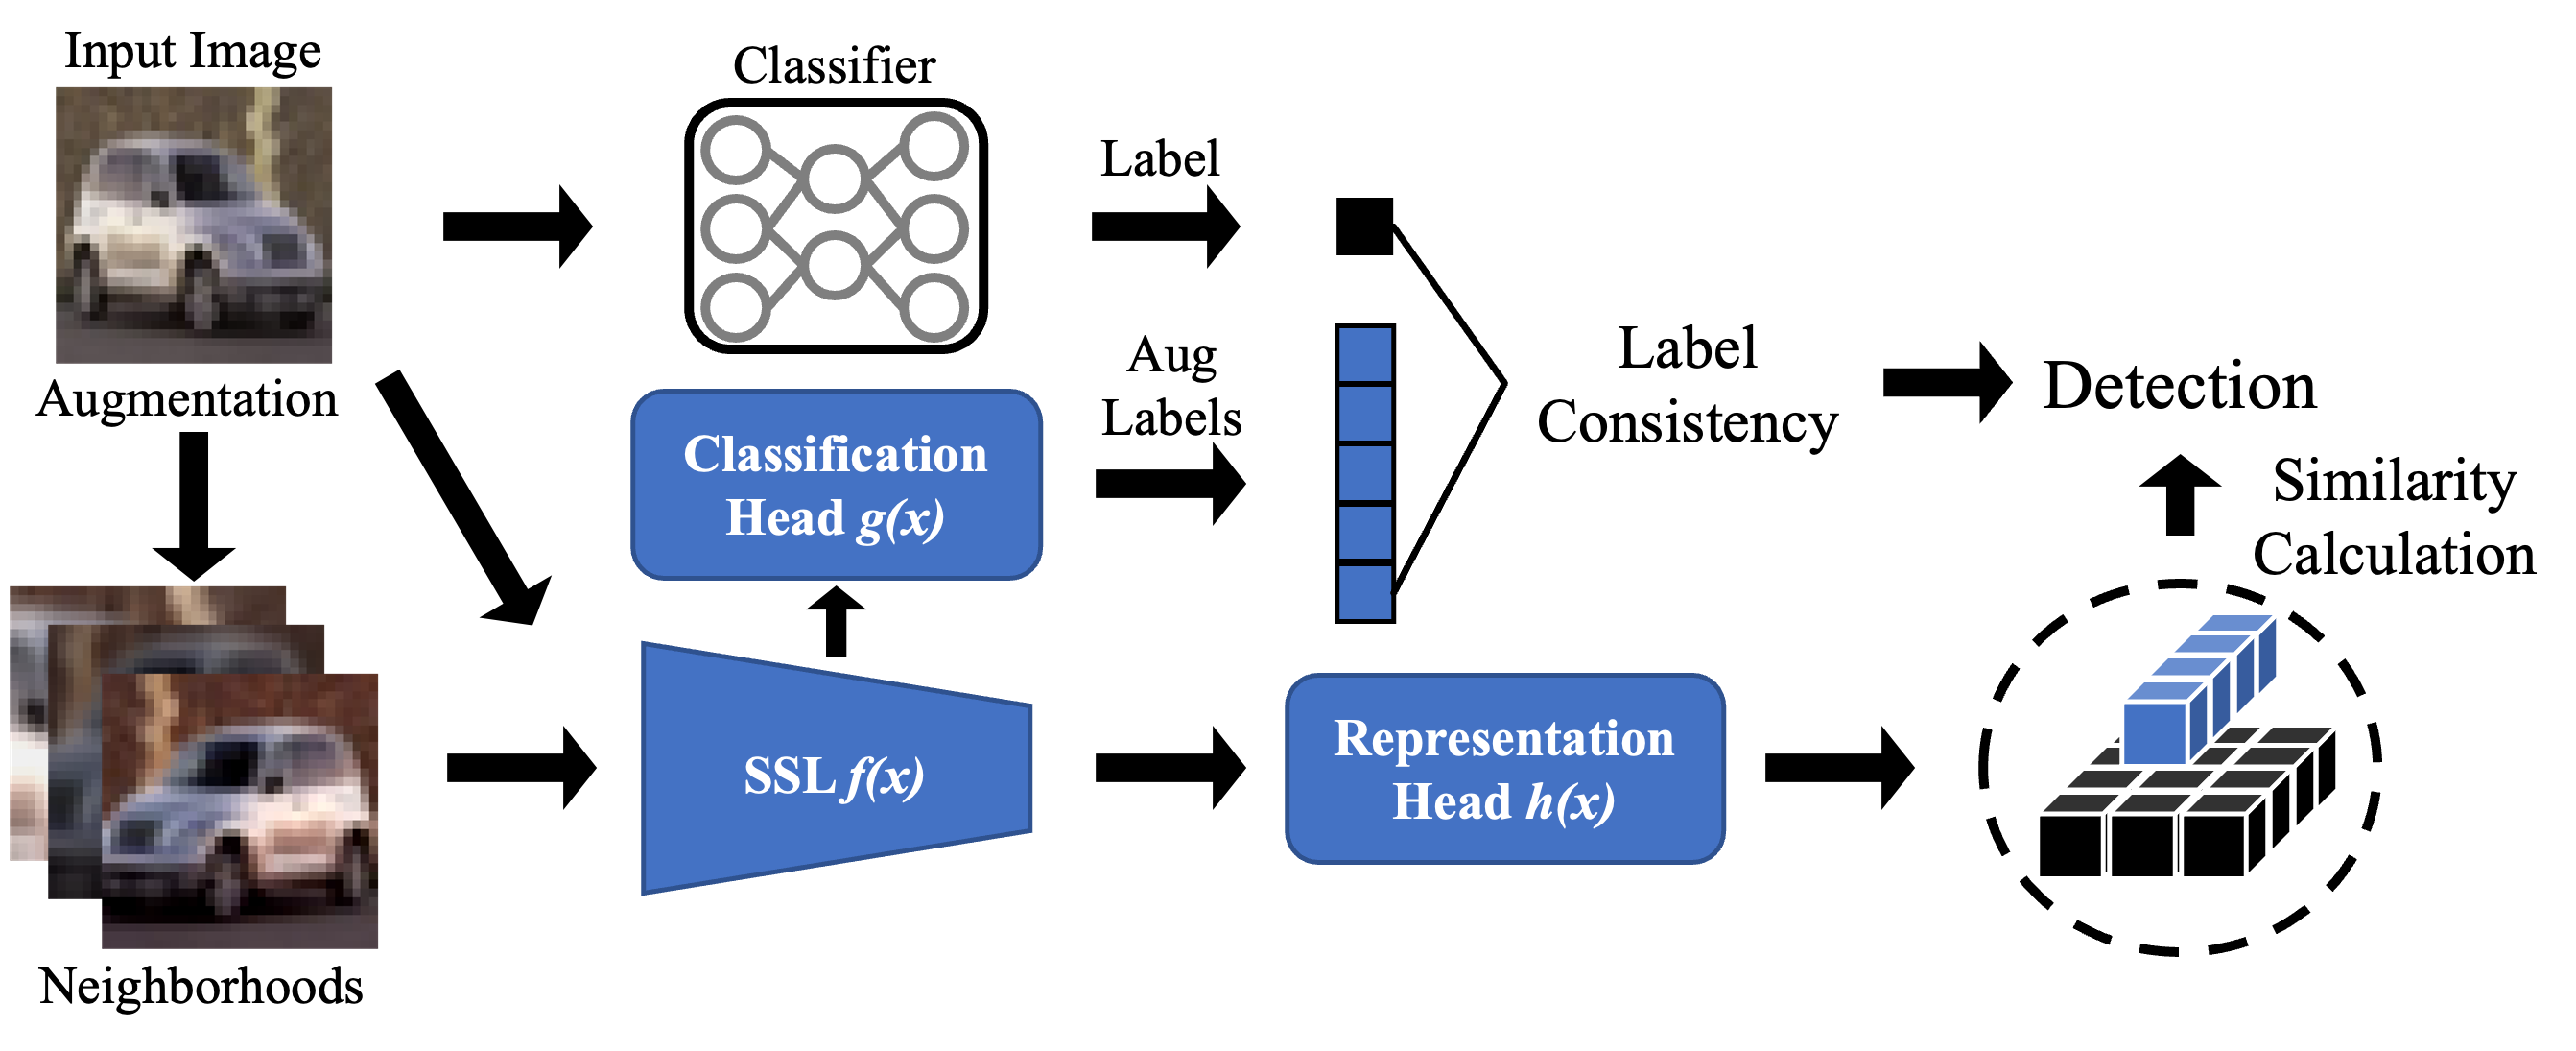
The previous method, Latent Neighbourhood Graph (LNG), represents the relationship between the input sample and the reference sample as a graph, whose nodes are embeddings extracted by DNN and edges are built according to distances between the input node and reference nodes, and train a graph neural network to detect AEs.

In this work, We explore the relationship between inputs and their test-time augmented neighbours. As shown in Figure. 1, clean samples exhibit a stronger correlation with their neighbors in terms of label consistency and representation similarity. In contrast, AEs are distinctly separated from their neighbors. According to this observation, we propose BEYOND to detection adversarial examples.

Method Overview of BEYOND

Method Overview of BEYOND

Figure 2. Overview of BEYOND. First, we augment the input image to obtain a bunch of its neighbors. Then, we perform the label consistency detection mechanism on the classifier’s prediction of the input image and that of neighbors predicted by SSL’s classification head. Meanwhile, the representation similarity mechanism employs cosine distance to measure the similarity among the input image and its neighbors. Finally, The input image with poor label consistency or representation similarity is flagged as AE.

Detection Performance

Table 1.The Area Under the ROC Curve (AUC) of Different Adversarial Detection Approaches on CIFAR-10. LNG is not open-sourced and the data comes from its report. To align with baselines, classifier: ResNet110, FGSM: ε = 0.05, PGD: ε = 0.02. Note that BEYOND needs no AE for training, leading to the same value on both seen and unseen settings. The bold values are the best performance, and the underlined italicized values are the second-best performanc
AUC(%) Unseen: Attacks used in training are preclude from tests Seen: Attacks used in training are included in tests
FGSM PGD AutoAttack Square FGSM PGD CW AutoAttack Square
DkNN 61.55 51.22 52.12 59.46 61.55 51.22 61.52 52.12 59.46
kNN 61.83 54.52 52.67 73.39 61.83 54.52 62.23 52.67 73.39
LID 71.08 61.33 55.56 66.18 73.61 67.98 55.68 56.33 85.94
Hu 84.51 58.59 53.55 95.82 84.51 58.59 91.02 53.55 95.82
Mao 95.33 82.61 81.95 85.76 95.33 82.61 83.10 81.95 85.76
LNG 98.51 63.14 58.47 94.71 99.88 91.39 89.74 84.03 98.82
BEYOND 98.89 99.28 99.16 99.27 98.89 99.28 99.20 99.16 99.27

Adaptive Attack

Attackers can design adaptive attacks to try to bypass BEYOND when the attacker knows all the parameters of the model and the detection strategy. For an SSL model with a feature extractor f, a projector h, and a classification head g, the classification branch can be formulated as C= f ° g and the representation branch as R = f ° h. To attack effectively, the adversary must deceive the target model while guaranteeing the label consistency and representation similarity of the SSL model.

$$ \displaystyle Loss_{label} = \frac{1}{k} \sum_{i=1}^{k} \mathcal{L}\left(\mathbb{C}\left(W^i(x+\delta) \right), y_t\right) $$

where k represents the number of generated neighbors, yt is the target class, and L is the cross entropy loss function.

Performance of BEYOND against Adaptive Attacks

We evaluate the detection performance of BEYOND against adaptive attacks on different datasets and show the ROC curves under different perturbation budgets as follows:

Loading...

BibTeX

@article{li2024greatscore,
  title     = {GREAT Score: Global Robustness Evaluation of Adversarial Perturbation using Generative Models},
  author    = {Zaitang, Li and Pin-Yu, Chen and Tsung-Yi, Ho},
  journal   = {NeurIPS},
  year      = {2024},
}